The Lean Learn Phase: Pivot or Persevere
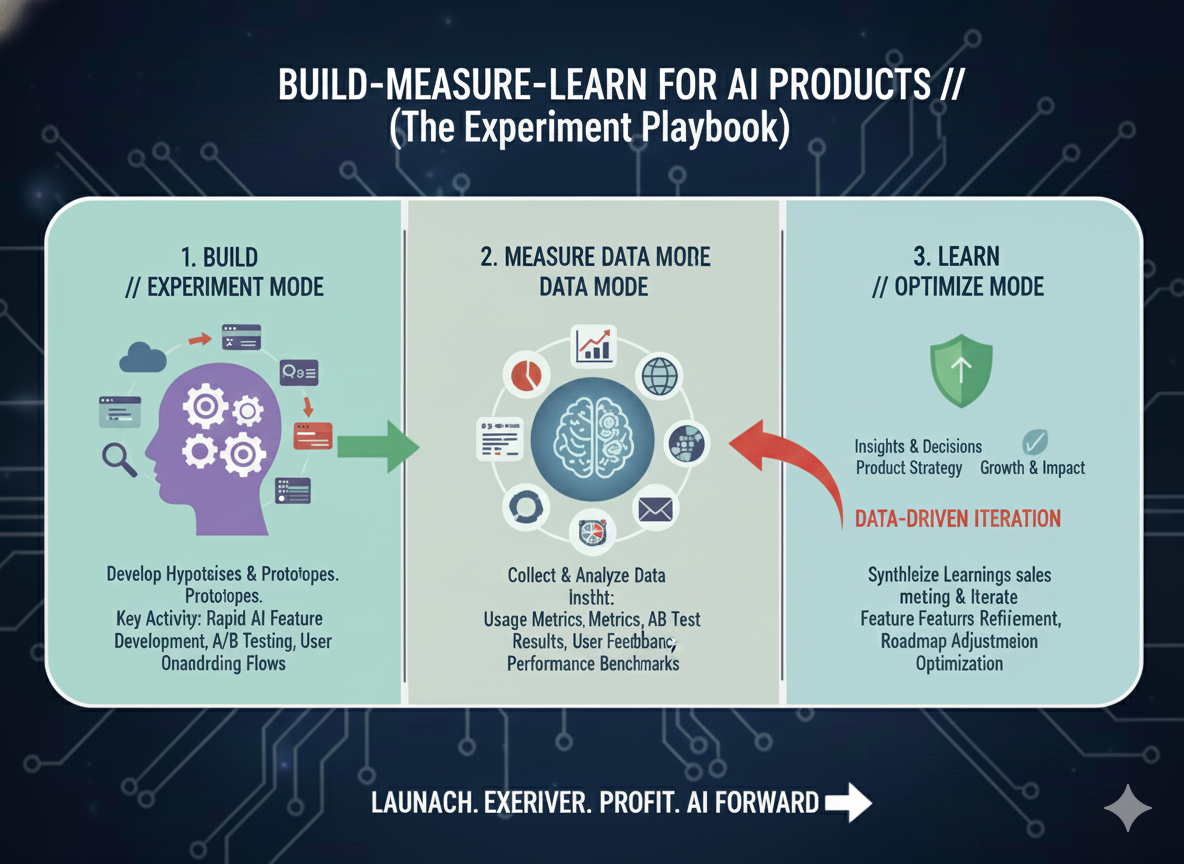
The decisive acceleration point of the Build-Measure-Learn (B-M-L) cycle is the Learn phase. This is not the time for more data collection; it's the crucible where low-cost research from the Build phase and hard metrics from the Measure phase forge into a single truth.
The goal of the Lean founder is to move past ambiguity and achieve validated learning, executing the most resource-efficient strategic move: the Pivot or Persevere decision. For the Solopreneur, this phase is the engine of Velocity toward Product-Market Fit (PMF), transforming ambiguous speculation into a clear, scientifically informed roadmap for the next Minimum Viable Product (MVP).
Map Emotional Friction – The Pursuit of the Unstated Need
Quantitative metrics establish the what—the churn rate, the activity level, and the geo-cluster density. But the crucial context of why and how your audience feels about their problems is locked within the qualitative data. The why is the foundation of your value proposition.
Targeting Qualitative Extraction and Unstated Needs
Your manual effort must be hyper-focused to maximize resource efficiency. Do not read every post; read the ones that count.
Focus on Trending Threads: Concentrate your time on the most active, trending threads identified in the Measure phase (e.g., high-volume channels in Discord or forum analytics).
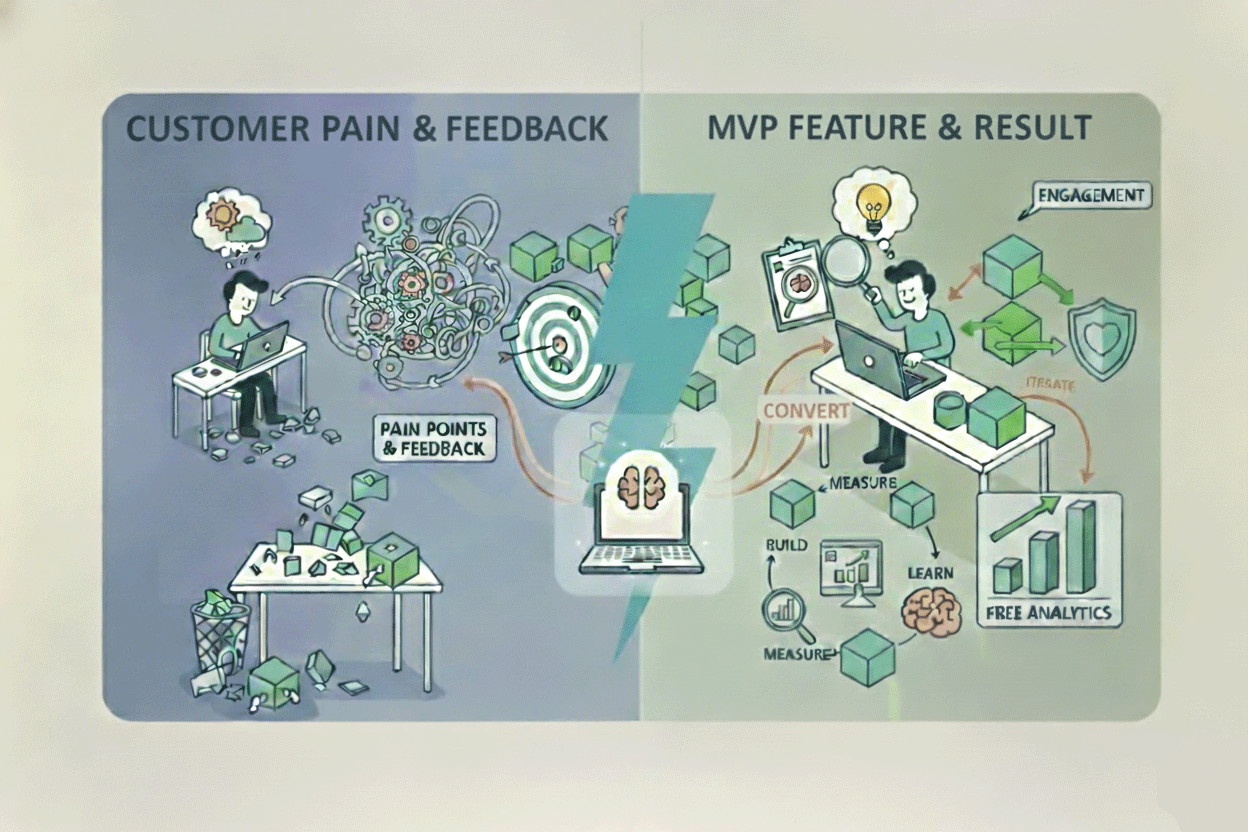
Extract Quotes, Not Summaries: The goal is to capture direct, verbatim quotes that convey emotional tenor and surface unstated needs. An unstated need is what the user really wants, often expressed as frustration with a current task, but not yet formulated as a feature request. Look for phrases like: "I spend hours every week dealing with this," or "I wish there was an easier way to..."
- Transcribe Pain Points: Create a simple spreadsheet. List the quote, the platform, and assign a simple emotional label (e.g., Frustration, Apathy, Relief).
Affinity Mapping: Structuring the Chaos
Raw quotes are messy; affinity mapping turns them into actionable themes. Use free whiteboarding tools like Miro or Canva to organize and structure your raw findings.
The synthesis process involves grouping similar quotes and themes together through affinity mapping, often using color-coded virtual sticky notes to categorize recurring pain points, motivations, and goals.
Key Affinity Categories for Lean Startups:
| Category | Description | MVP Implication |
|---|---|---|
| High Friction | Recurring difficulty/bug with existing solutions. | Mandatory Feature: Direct competitive fix. |
| Cost Barrier | Complaints about pricing models (e.g., "too expensive for one small feature"). | Pricing Pivot: Offer a free tier or highly targeted feature pack. |
| Apathy/Boredom | Lack of engagement with existing solution category. | Pivot: Is the problem severe enough? Consider a new audience. |
Building Customer Journey Maps (CJMs) for Prioritization
The Customer Journey Map (CJM) is the ultimate synthesis tool. You must use the qualitative data to map the customer's Thoughts and Feelings at each step. The emotional line on the CJM becomes your primary feature prioritization tool:
Identify Where to Act: Pinpoint the most significant "dips" in emotional state on the CJM. These low points represent market gaps and automatically prioritize the smallest, highest-impact features for your next MVP.
- The High-Return Trade-off: If your map shows users are "Anxious" and "Stuck" at a competitor’s documentation step, your next MVP feature must be a small, highly usable widget that directly targets that emotional friction. This ensures you build the feature that provides maximum emotional return for minimum resource investment.
Mixed-Methods Analysis – Escaping the Anecdotal Trap
The Lean process demands conviction. To ensure your findings are verified and not coincidental, you must systematically compare your quantitative metrics (Measure Phase) and qualitative narratives (Learn Phase). This mixed-methods analysis prevents you from falling in love with a few compelling quotes that may not represent the whole audience.
Convergence: Validated Hypotheses
Convergence occurs when the same theme appears consistently in both data types, meaning the finding is strongly validated. This is the most powerful signal for investment.
Convergence Example:
| Data Type | Finding | Conclusion |
|---|---|---|
| Quantitative (Discord Insights) | 70% of highly active users are concentrated in the Texas/Southwest geo-cluster. | The market density hypothesis (Build Phase) is confirmed. |
| Qualitative (Forum Quotes) | Manual extraction reveals dozens of quotes from users explicitly mentioning "Texas" or "Houston" while complaining about local infrastructure pain points. | Strongly Validated. The problem is both geographically dense and severely felt. You must persevere in this region. |
Divergence: Investigative Opportunities
Divergence—where the data types disagree—is not a failure; it’s an investigative opportunity to discover a sensitive or nuanced truth about your audience.
Divergence Example:
| Data Type | Finding | Conclusion (Investigation Required) |
|---|---|---|
| Quantitative (Survey Result) | 85% of users selected "Willing to pay $20/month" for Solution X. | High stated willingness to pay. |
| Qualitative (Forum Observation) | Zero discussion of Solution X pricing; frequent complaining about high competitor costs. | Divergence. Users may be saying they will pay, but their public behavior suggests they are highly price-sensitive. A follow-up experiment (A/B testing a landing page with a price) is required before launch. |
If a topic receives high reported interest in a survey but exhibits low activity in public forums, it might indicate the issue is a sensitive or private concern not suited for public discussion. Understanding these differences provides deeper clarity on user behavior and preference.
Accelerate Decisions with LLM Emulation – The AI Co-founder
The transition from Measure to Learn is often the slowest step due to the effort required for manual synthesis. To drastically shorten this time—allowing you to pivot or iterate faster—you can emulate the functionality of specialized analytical AI tools using a generic Large Language Model (LLM) through strategic prompt engineering.
The AI Co-founder: Structured Prompt Engineering
You cannot feed the LLM 100 raw quotes. You must feed it your structured synthesis data (CJMs, quantitative tables, validated pain point lists).
The Role-Playing Prompt:
Prompt the AI to act as a "Senior Market Analyst" or "AI Co-founder." Give it a precise, data-rich context, and demand a specific output format.
The AI Co-founder: Structured Prompt Engineering
By forcing the LLM to synthesize data that you have already validated, you use its pattern recognition capability to immediately draw conclusions and structure the next Build plan. This cuts days off the decision-making process, which is critical since faster iteration is the engine of sustainable growth.
The Final Threshold – Pivot or Persevere
Your final decision—the Pivot or Persevere moment—must be tied to predefined Minimum Success Criteria (MSC)—the Innovation Accounting metrics—established before the experiment began. This is the scientific rigor that prevents founders from falling victim to sunk cost fallacy.
The Minimum Success Criteria (MSC) as a Decisive Threshold
Your MSC should directly relate to the hypothesis you tested and act as a Go/No-Go metric.
Example MSC Scenarios:
| Initial Hypothesis | MSC (Go/No-Go Metric) | Data Outcome | Decision & Reason |
|---|---|---|---|
| Problem: Developers lack a single dashboard for dependency tracking. | Persevere if 60%+ of survey respondents confirm "dependency tracking" is their highest priority problem. | Survey confirmed 75% priority AND forum activity is high. | Persevere: Problem is validated. Now, iterate the solution based on the CJM. |
| Audience: Small business owners (revenue under $50k) will pay $5/month for a simple tool. | Persevere if initial soft launch CTR (cost-per-acquisition) is under $2. | CTR is $25, and qualitative data shows high price sensitivity. | Pivot: The audience is price-sensitive; the hypothesis about their Willingness to Pay is invalidated. Change the audience or the business model. |
The Pivot Playbook in Action
Persevere (Iterate): This is appropriate when the problem hypothesis is validated (e.g., severe, unaddressed need confirmed by the convergence of data) but the proposed solution requires refinement. The next set of features must be small, targeted, and designed to fix the emotional dip.
Pivot (Change Hypothesis): This is necessary if the initial persona or problem is definitively invalidated. This occurs if the audience has a low willingness to pay, the pain point is easily solved by an existing tool, or the market is too diffuse.
The Kill Decision: If you pivot twice and the new hypotheses are also quickly invalidated, the Lean process mandates that the project be killed—a necessary, resource-saving decision to redirect capital to a new venture.
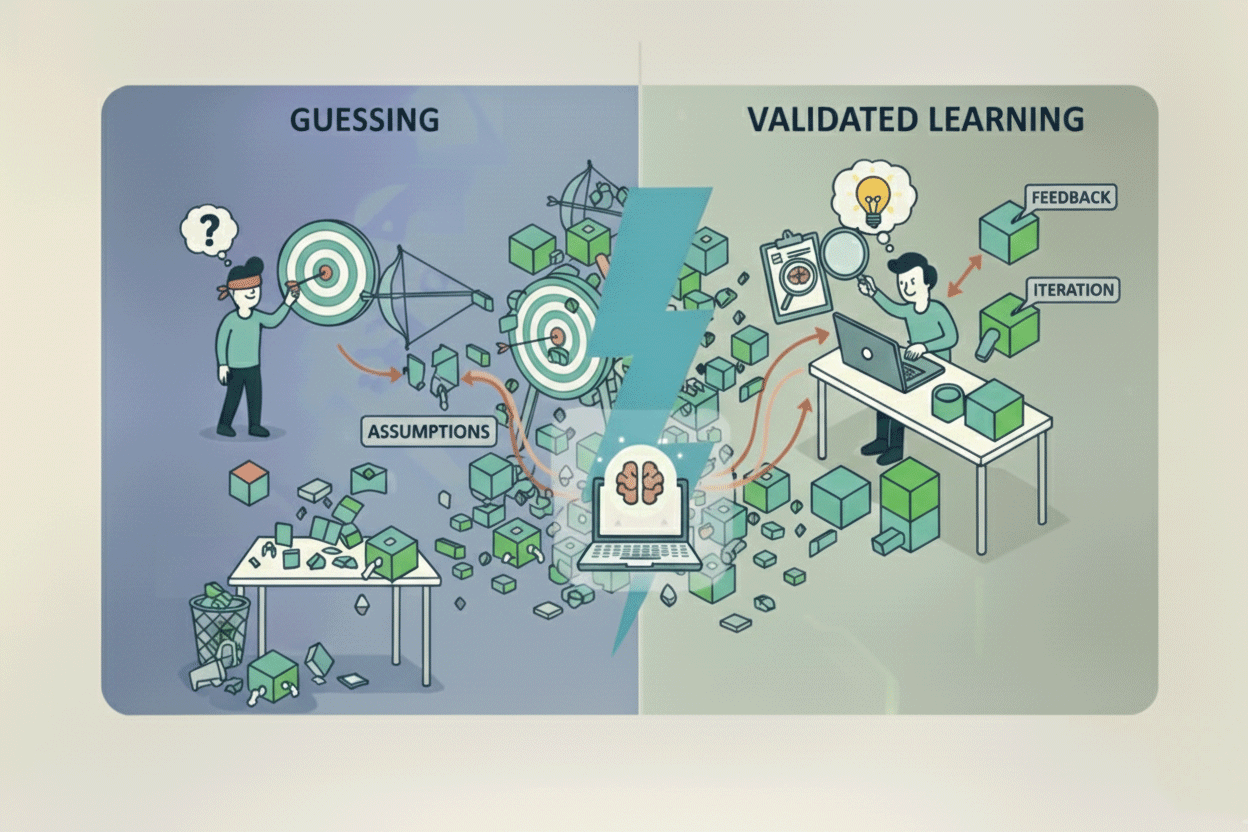
"The validated learning then immediately structures the input for the next Build cycle. You don't guess at the next feature; you build the feature that directly addresses the lowest emotional point on your CJM, tested against new, higher Innovation Accounting metrics."
The validated learning then immediately structures the input for the next Build cycle. You don't guess at the next feature; you build the feature that directly addresses the lowest emotional point on your CJM, tested against new, higher Innovation Accounting metrics. This is the engine of sustainable startup development.
This final post completes the full B-M-L cycle, demonstrating how a founder can move from raw observation to a confident strategic decision using only free or low-cost tools and a methodologically rigorous framework.
No comments yet
Be the first to share your thoughts on this article!