Traditional financial metrics—revenue, profit, market share—are irrelevant when you are trying to validate a core market hypothesis. At this stage, your business is an experiment, and you must measure its success by its ability to learn and iterate. Early-stage founders must, therefore, adhere to Innovation Accounting—a novel, essential approach to tracking progress, setting milestones, and prioritizing tasks tailored specifically to startup needs. This requires utilizing actionable metrics derived exclusively from observable, digital community activity.
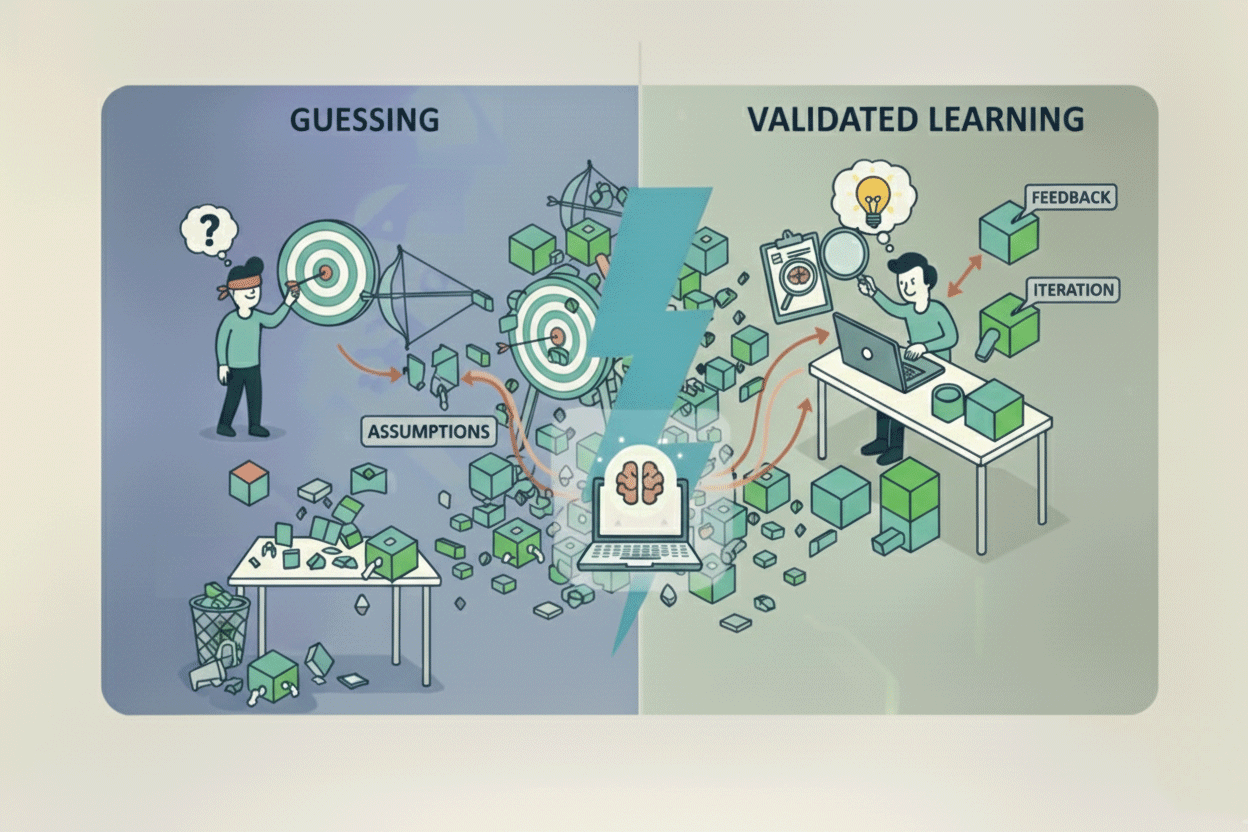
The Measure Phase of the Build-Measure-Learn (B-M-L) cycle is the process of rigorously quantifying the success or failure of the assumptions you created in the Build Phase. It requires you to track the location and activity of your potential customers using built-in, free, or freemium tools. This structured measurement transforms the raw observation of forum activity into quantifiable, repeatable metrics suitable for Innovation Accounting, giving you the conviction you need to proceed to the next step.
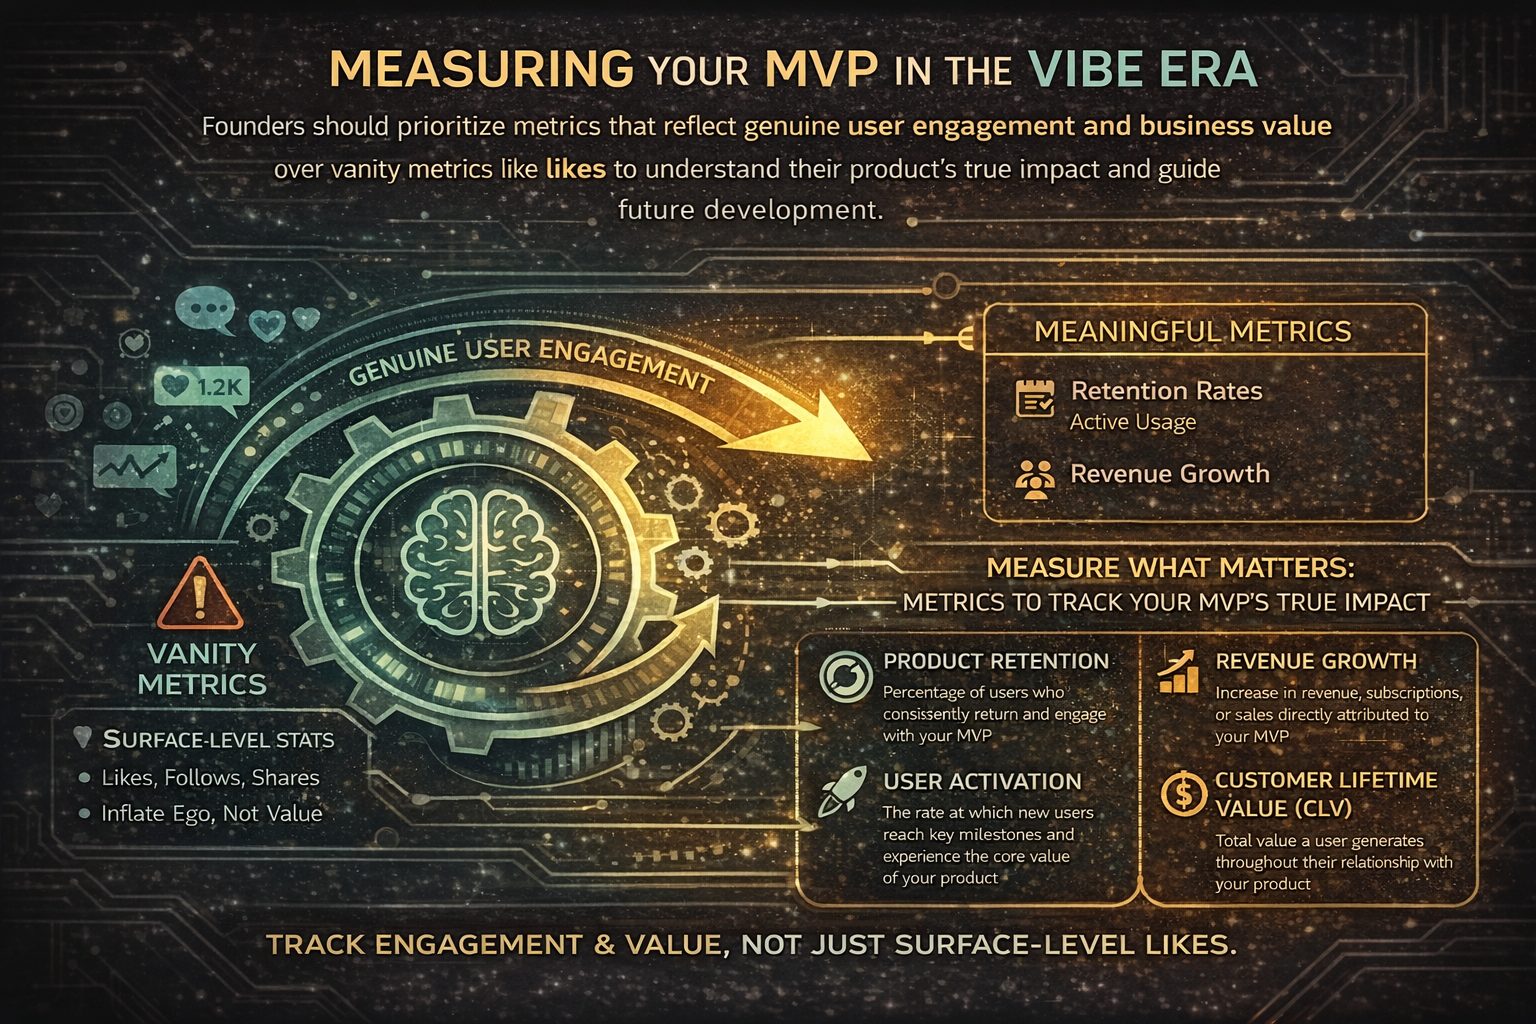
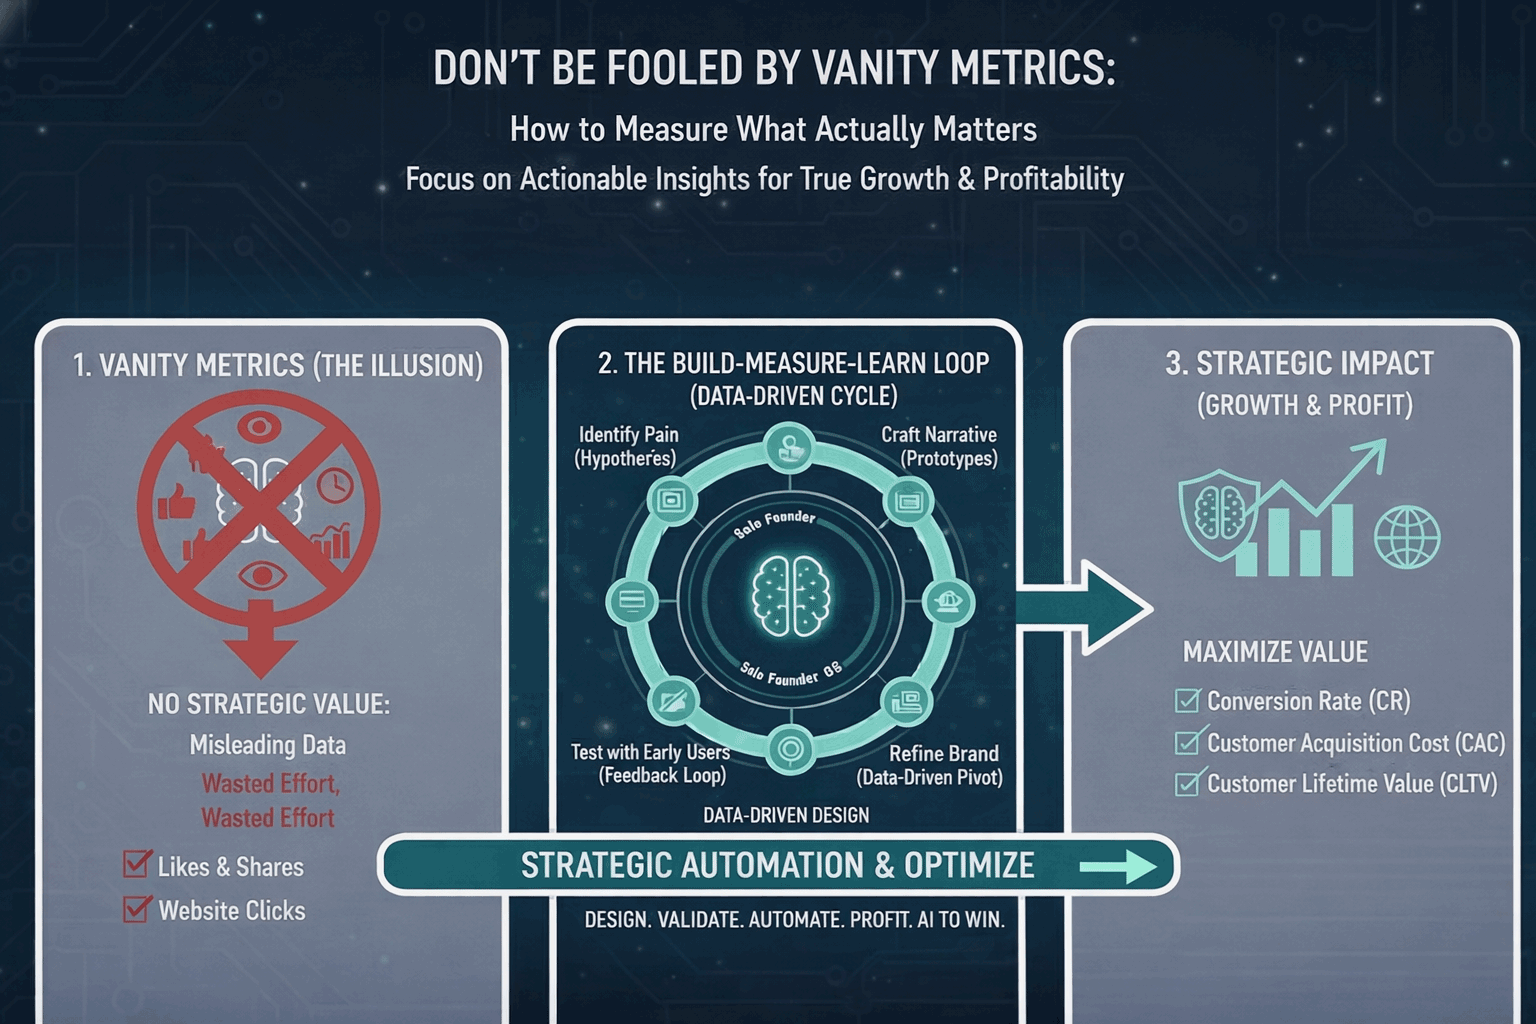
The Strategic Shift: From Vanity Metrics to Actionable KPIs
Innovation Accounting mandates that we ignore vanity metrics (like total server member count or total website visits) and focus only on actionable metrics that inform the Pivot or Persevere decision.
For a resource-constrained founder, the most critical Innovation Accounting KPIs during the Measure Phase center on efficiency and fidelity:
Cost per Validated Learning Cycle: The total expense (time and money) required to move from one hypothesis (Build) through measurement to a decisive conclusion (Learn). Your goal is to keep this cost as close to zero as possible.
Identification Rate: The percentage of active community members tracked who demonstrably fit the criteria of your Proto-Persona (established in the Build Phase). A low rate suggests you are in the wrong "watering hole."
Engagement Index: A composite metric (detailed below) that quantifies average daily activity and retention.
Extract Actionable Metrics from Community Platforms
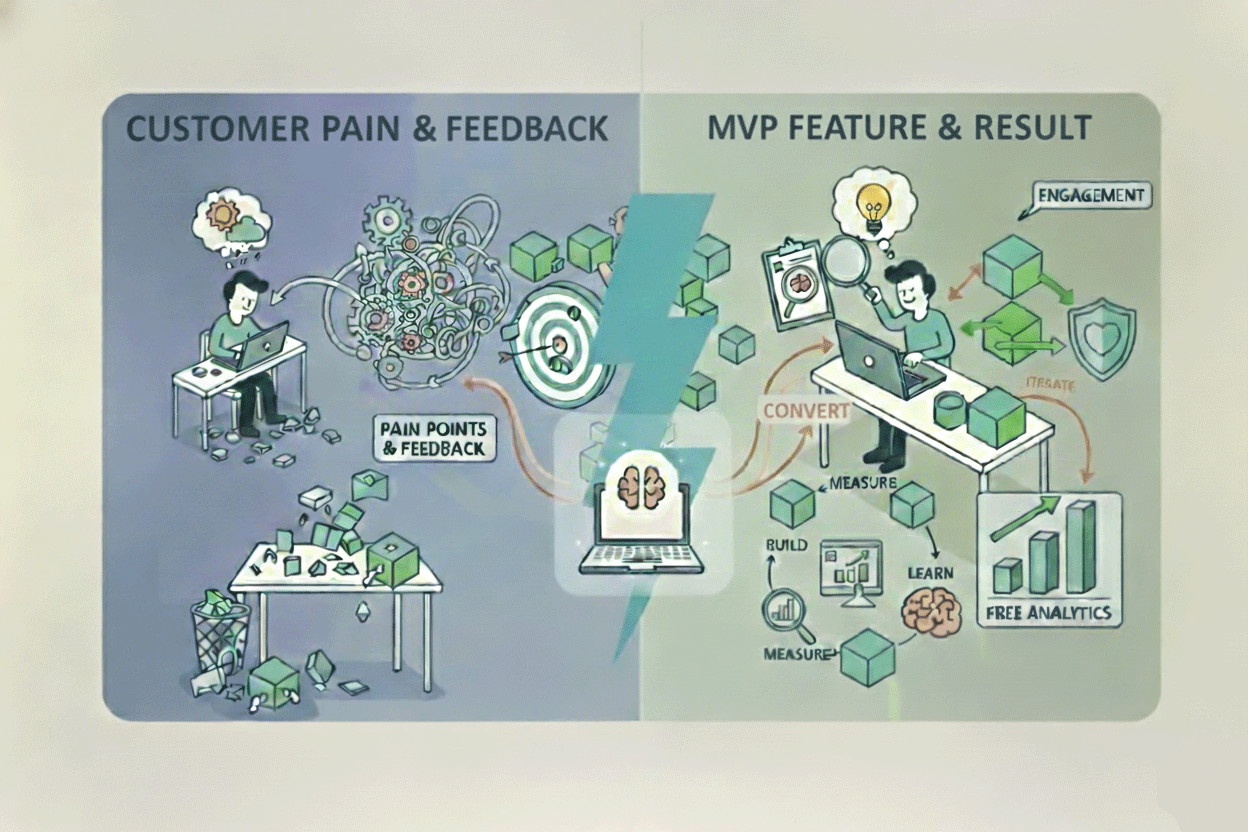
If your target audience congregates in online communities—like Discord, Slack, or Discourse—you can leverage the built-in free analytics to establish a quantitative baseline of community health.
| Tool | Primary Output/Metric | Lean Validation Use Case |
|---|---|---|
| Discord Server Insights | Member Activity, Country of Origin, Device Usage | Identifying active market segments and technical maturity (device type). |
| Discourse Analytics | Emotional Scoring, Trending Topics | Identifying high-friction areas and immediate pain points for MVP targeting. |
Deep Dive: Discord Server Insights for Behavior and Literacy
Discord, when Community features are enabled, offers a robust set of free Server Insights that are a goldmine for the Lean founder.
Activity: You must track metrics such as daily member joins, leaves, and retention rates. Critically, the analytical focus should be on the active members (those who have viewed a channel in the last 28 days), as this group represents the actual, engaged community dynamics, which can differ significantly from the meaningless total member count. A better metric is MUD (Messages per User per Day). A high MUD is a strong indicator of an engaged community—one that is both suffering from problems and actively seeking solutions.
Technical Literacy: The Hidden Churn Indicator: Discord Insights can reveal the age of user accounts and the devices they use to access the platform. This data is crucial for risk mitigation:
Account Age: A high percentage of users new to Discord (e.g., account age under one month) suggests your MVP design and onboarding process must be heavily simplified. If your audience is new to community platforms, complexity in your product will translate directly into early churn, thus avoiding wasted development effort.
Device Usage: If a large segment of your active users primarily access the platform via mobile, your MVP must be mobile-first and high-performance.
Deep Dive: Discourse and Slack for Pain Point Proxies
To refine your problem hypothesis, you need to quantify frustration.
Discourse Analytics (Emotional Scoring, Trending Topics): Discourse is modern forum software with native analytics. Its key strength is providing quantitative proxies for understanding user satisfaction levels through sentiment and emotional scoring of discussions. This allows you to pinpoint specific areas of high emotional friction—the most painful points—without having to manually read every thread.
The Quantitative-Qualitative Bridge: Use the "trending topics" feature, available in Discourse and often via third-party freemium analytics for Slack. A high quantitative count (e.g., 500 posts/week on Topic X) immediately signals the community's current, highest-priority concern. This metric serves as a critical resource-saving filter: it ensures your subsequent qualitative research (in the Learn Phase) focuses only on the most active and relevant discussions, preventing resource waste on tangential conversations.
Slack Free Tier Workaround: Since the free version of Slack provides only basic analytics, resource-constrained founders must be resourceful. Look for third-party tools that offer a free trial period. Even a 7-day free trial, used strategically, can provide the necessary snapshot of member activity, lurker ratios, channel usage, and trending topics to establish a baseline for your Innovation Accounting. The temporary cost of a free trial is often justified by the acceleration of learning it provides.
Visualize Geographic Concentration to Reduce Risk
Risk mitigation is paramount for early-stage founders. Visualizing your audience's location helps transform abstract demographic percentages into a concrete strategy for market entry and resource allocation.
Step 1: Collect and Structure Raw Location Data
You must obtain the country or city data from your community analytics (e.g., Discord Insights). This raw list of locations is not immediately useful until you apply a behavioral filter.
Step 2: Conceptual K-Means Clustering for Resource Focus
While complex Geographical Information System (GIS) tools are costly, you can perform a conceptual K-Means clustering manually or semi-manually within Excel or Google Sheets. The goal here is not mathematical precision but strategic segmentation.
How to Execute Conceptual Clustering:
Define Clusters (Hypothetical Centroids): Define a small number of strategic segments, such as:
- High-Potential (Red): Locations with high MUD AND high pain point density.
- Medium-Activity (Yellow): Locations with moderate MUD and low pain point density.
- Low-Priority (Gray): Locations with low activity.
Assign Locations: Assign each city/country from your raw data into one of these three clusters based on the metrics gathered in Section 1.
Step 3: Visualize with Google My Maps for Action
Use Google My Maps—a powerful, free tool—which allows you to map multiple locations directly from spreadsheet data (CSV or Excel).
You must represent the activity clusters identified in your spreadsheet using different colors or marker icons on the My Map visualization.
- Red Markers: High-Potential Cluster (Primary MVP launch target).
- Yellow Markers: Medium-Activity Cluster (Target for scaled launch 6 months post-MVP).
- Low-Priority (Gray): Locations with low activity.
This visualization process provides a concrete, resource-saving filter. By visually confirming that the majority of active pain points are concentrated in a specific region, you can confidently focus your initial launch. This prevents wasting resources on costly global infrastructure or diffuse marketing, conserving capital, mitigating the risk of regulatory complexity, and maximizing the chance of achieving clean, actionable data for the crucial Learn Phase of the B-M-L loop.
The Measure Phase, driven by Innovation Accounting, transforms the fuzzy concept of "audience" into a structured, quantitative, and geographically-defined target. You now have a verifiable baseline and a clear map of where to deploy your minimal solution next.
In the next post Translating Customer Emotion into Your Next MVP Feature (The Learn Phase), we'll dive into the Learn Phase, where we translate these metrics into confident Pivot or Persevere decisions, systematically analyzing evidence for validated learning and a clear feature roadmap for your next MVP.
No comments yet
Be the first to share your thoughts on this article!