
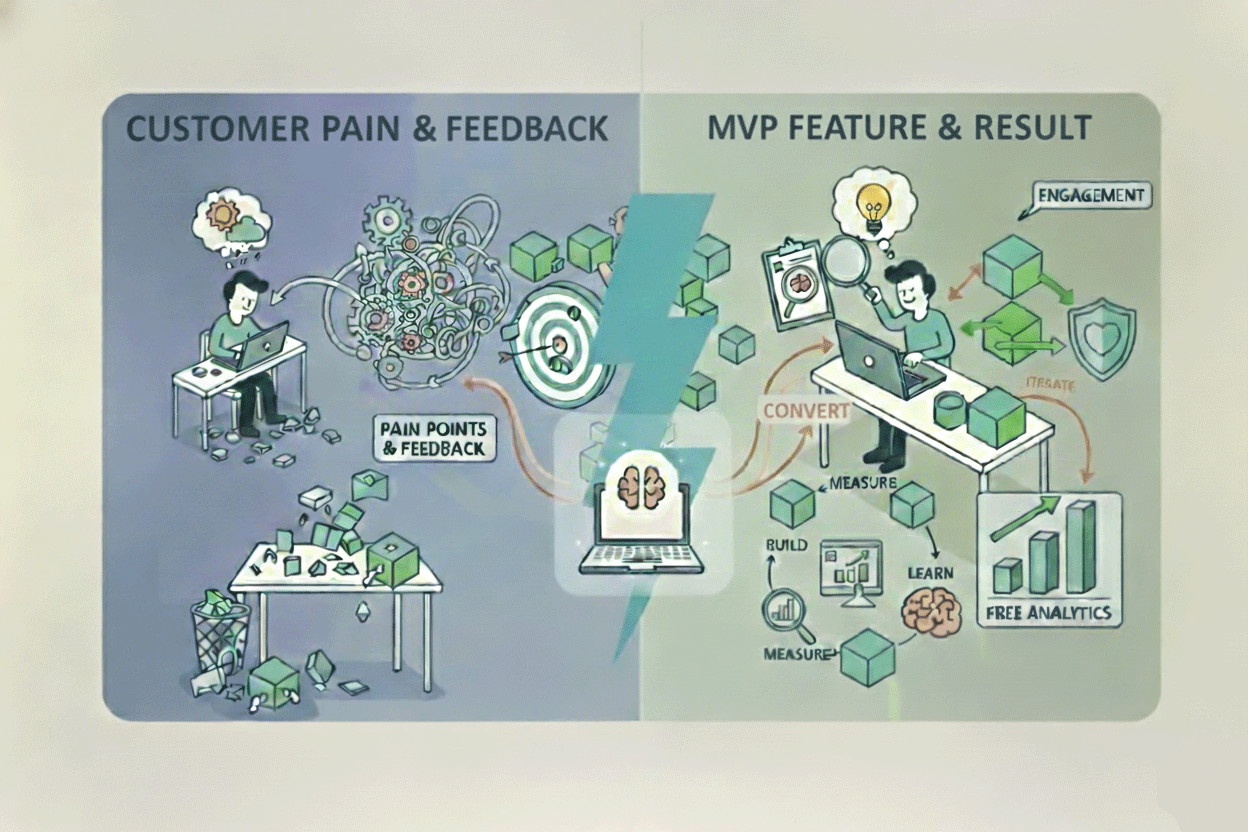
As a founder or solopreneur, your most precious resources are time and capital. Every dollar and hour you spend must be maximized for learning, not wasted on building features nobody needs. This is the heart of Validated Learning—the core principle of the Lean Startup methodology—which mandates that every business activity be treated as an experiment to maximize learning efficiency. Your goal isn't just to build a product; it’s to figure out how to build a sustainable business with the least amount of waste possible.
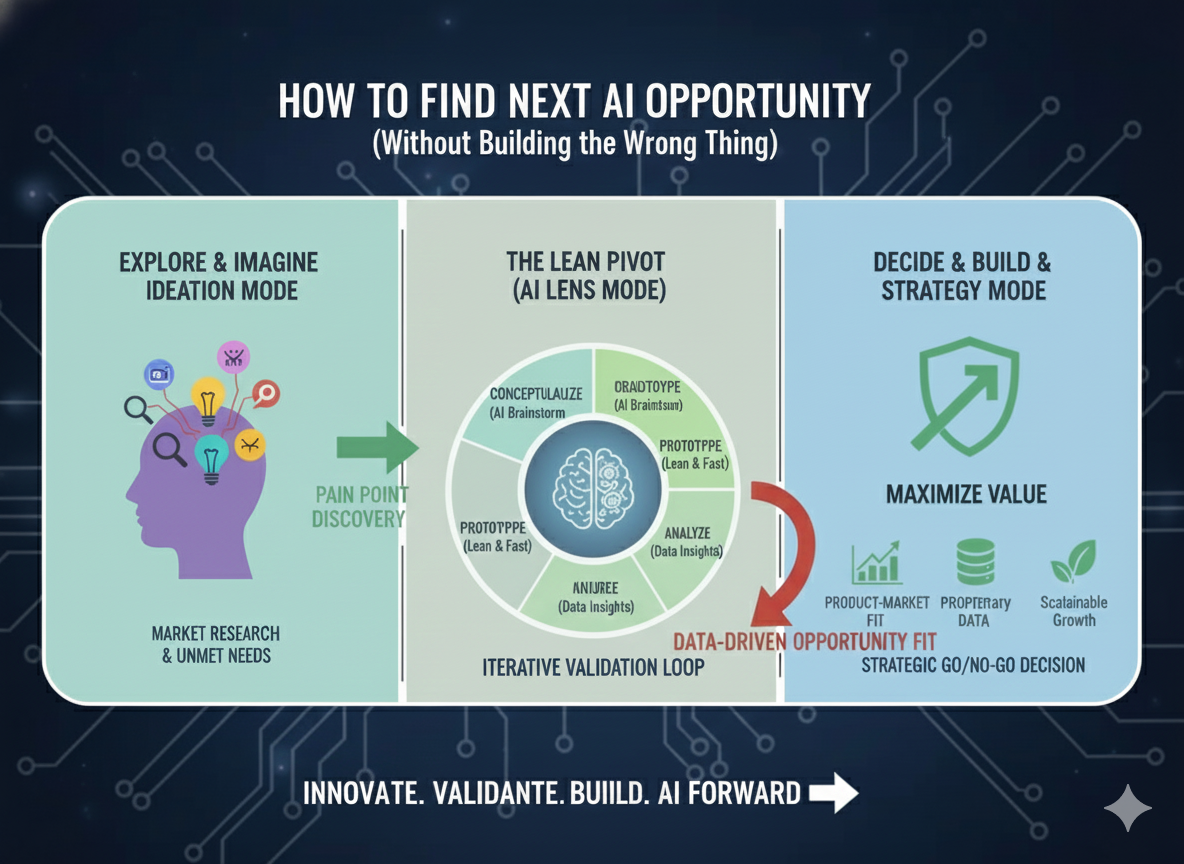
The biggest risk an early-stage company faces is not product failure, but the risk of building the wrong thing entirely—a product perfectly designed to solve a problem that nobody urgently cares about or is willing to pay for. The Build Phase is your defense against this waste. Before you write a single line of code or commit significant money to development, you must complete the initial Build Phase by rigorously mapping your audience using free tools. This audience map, focused on testing your core assumptions about who has which problem where, is your lowest-cost Minimum Viable Product (MVP) required during the crucial Customer Discovery phase.
Maximize Leverage by Defining the Core Problem
The most powerful point of leverage in the entire Build-Measure-Learn (B-M-L) cycle lies in maximizing the fidelity of your initial "Build" input. Focus is paramount. Your hypothesis must pivot away from your eventual solution (e.g., "We will build an AI-powered calendar") and intensely focus on the customer's core, unaddressed problem (e.g., "Busy professionals cannot reliably find an empty slot for team meetings without six back-and-forth emails") and, critically, where they discuss it. This initial research must provide compelling early proof of a dense concentration of unmet need.
The Problem vs. Solution Keyword Tactic (Google Trends)
When using Google Trends, your keyword selection is an experiment in itself. You need to identify two types of keywords and compare them:
- Problem-Centric Keywords: Phrases people use when they are suffering. These often contain emotion or descriptive pain (e.g., "why does my API keep failing," "manual invoice tracking errors," or "best way to avoid zoom fatigue"). High sustained interest in these terms indicates an unmet need.
- Solution-Centric Keywords: Phrases people use when they know a product category exists (e.g., "best CRM for small business," "project management software," or "cloud accounting platform").
The Analysis: If the search volume for your Problem-Centric Keywords is significantly higher and more sustained than the Solution-Centric Keywords, it suggests a large, frustrated audience that hasn't yet found or committed to a specific solution category. This is the ideal green-field market for a disruptive MVP.
Deconstructing Data Rigorously with Google Trends
Google Trends data is free, but you must treat it like gold. The key is understanding how the platform normalizes results:
-
The 0-100 Scale: Google Trends normalizes results from 0 to 100, which accounts for total search volume within a given time and region. A value of 100 represents the peak interest for that keyword during the specified time. This means the numbers are relative, not absolute search counts. This relativity is a resource-constrained founder's secret weapon, as it allows for fairer comparisons between different regions and topics, overcoming the massive data deficit compared to expensive SEO tools.
-
Sustained Interest Check: Look past momentary spikes. A problem that shows a continuous, high baseline interest over the last 5 years is far more stable and reliable for an investment hypothesis than one that spikes only during a specific annual event (e.g., tax season).
Identifying and Strategizing for Geographic Hotspots
For early market identification, you must zoom in on the data's geographic breakdown—often down to the city level.
A sustained spike in relative search volume in a specific city or region strongly suggests a concentration of need there. This finding is essential for early market sizing and deployment strategy, allowing you to focus your limited marketing and outreach resources on a high-density, high-need cluster.
Tactical implications of a hotspot:
- Small, Isolated Hotspot: If your highest-need cluster is a smaller, less technologically advanced city, your MVP must prioritize simplicity, ease of onboarding, and potentially lower pricing—it must be a solution that requires minimal hand-holding.
- Major Tech Hub Hotspot: If the need is spiking in a major hub like San Francisco or London, your persona is likely more technically sophisticated. Your MVP can afford to test more advanced features, and your pricing may reflect a higher willingness to pay, but you face intense competition.
Finding "Audience Watering Holes" (The SparkToro Tactic)
Knowing what people search for is only half the battle; knowing where they hang out and who they trust is how you craft your message. Utilize the limited searches on SparkToro’s freemium plan strategically. Since the free tier typically restricts you to five searches per month, every search must be precise.
Strategic Search Phrasing: Frame your limited searches around the behavior you observed in Google Trends. Instead of searching for "People who like SaaS," search for:
- "People who talk about The specific Problem-Centric Keyword"
- "People who read about Industry adjacent to the problem"
This technique allows you to gather foundational data on the social accounts, websites, and podcasts your target audience consumes. This Affinity Data is gold, as it reveals the crucial context for content creation and identifies existing trusted authorities. The tone and jargon used by these authorities must be reflected in your MVP messaging to establish immediate credibility. The affinity data essentially acts as a free, powerful psychographic map.
Triangulate Your Data for Confidence
Because you are relying on free, sampled, and inherently limited data sources (like Google Trends normalization or SparkToro sampling), methodological rigor requires triangulation of data.
A single data point—for example, a temporary regional search spike—is insufficient for validated learning. Reliance on one source is confirmation bias waiting to happen. To overcome this, you must set a standard for your Minimum Viable Data Set (MVDS): the smallest collection of confirmed, cross-referenced data points that gives you sufficient conviction to proceed to the Measure Phase.
The Triangulation Matrix
The process of triangulation requires a simple, structured method for comparison, which can be done easily in a free spreadsheet tool:
| Data Source | Finding | Confidence | Cross-Reference Check | Status |
|---|---|---|---|---|
| Google Trends | High sustained interest for "API auth failure" in Texas. | High | Cross-Reference: Discord/Forum location data. | Confirmed |
| SparkToro | Audience follows 3 specific niche tech podcasts. | Medium | Cross-Reference: Manual check of podcast episode titles for "auth failure" | Confirmed |
| Manual Forum Check | Recurring frustrated quote about competitor's pricing structure. | High | Cross-Reference: Competitor pricing pages and user reviews. | Confirmed |
If the hypothesis regarding market density is later cross-referenced and confirmed by demographic or location data derived from a community platform (like Discord Insights, which we will detail in the next post), your hypothesis regarding market density is strongly validated. This structured overlap of data sources provides the necessary conviction to proceed, effectively overcoming the inherent limitations of using free, sampled datasets.
Proto-Persona Components (Data-Driven Fields)
| Component | Input Source | Purpose |
|---|---|---|
| Title/Role | Google Trends (Jargon) / SparkToro (Websites) | Defines professional identity. |
| Geographic Cluster | Google Trends (Hotspot) | Defines target market for initial deployment. |
| Affinity Channels | SparkToro (Top 3-5 Podcasts/Sites) | Defines messaging channels and tone. |
| Frustration Quote | Manual Observation (Forums/Subreddits) | The exact, emotional language the customer uses to describe the problem. |
| Unstated Need | Triangulation Matrix (Convergence) | The underlying problem that the customer doesn't know how to solve. |
| Minimum Success Criteria (MSC) | Founder's Hypothesis | The threshold metric the next MVP must hit to justify continued investment. |
If the hypothesis regarding market density is later cross-referenced and confirmed by demographic or location data derived from a community platform (like Discord Insights, which we will detail in the next post), your hypothesis regarding market density is strongly validated. This structured overlap of data sources provides the necessary conviction to proceed, effectively overcoming the inherent limitations of using free, sampled datasets.
Example: Bridging Build to Measure
Build Finding: High need in Texas (GT) + Audience follows three niche tech newsletters (SparkToro).
Actionable Metric: We will launch a single, geo-targeted (Texas only) landing page that speaks directly to the "Frustration Quote." The metric to measure is Click-Through Rate (CTR) from a sponsored post in the most popular niche newsletter to the landing page.
Decision: If the CTR is above the industry average of 1.5%, we Persevere (the problem is real and addressable). If it's below 0.5%, we Pivot (the channel/messaging is wrong, or the problem is not severe enough).
This resource-constrained approach ensures you secure high-quality, actionable audience data—the critical indicator that justifies the subsequent, low-resource investment needed for the next iteration cycle. You've stopped guessing and have scientifically informed every single step you take.
You've stopped guessing and have scientifically informed every single step you take.
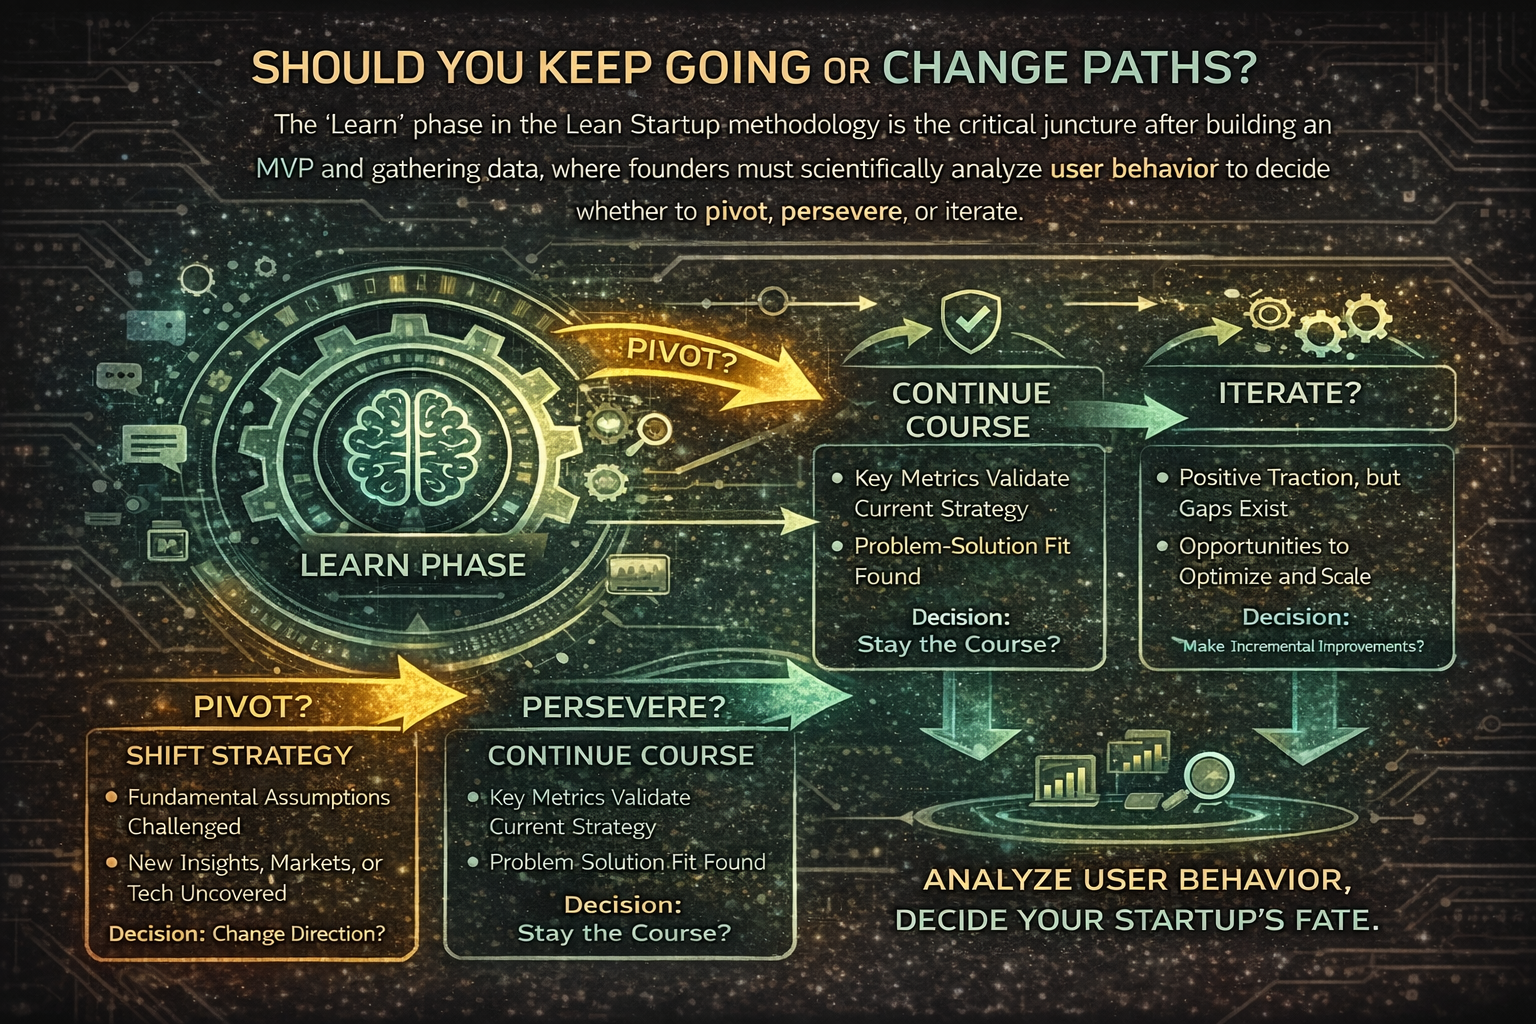
This post covered the crucial "Build Phase" of validating your startup hypothesis with a $0 research strategy. In our next post, "Tracking Community Health with Free Analytics (The Measure Phase)," we'll dive into how to rigorously quantify the success or failure of your assumptions and track progress using actionable metrics derived from observable, digital community activity.

No comments yet
Be the first to share your thoughts on this article!